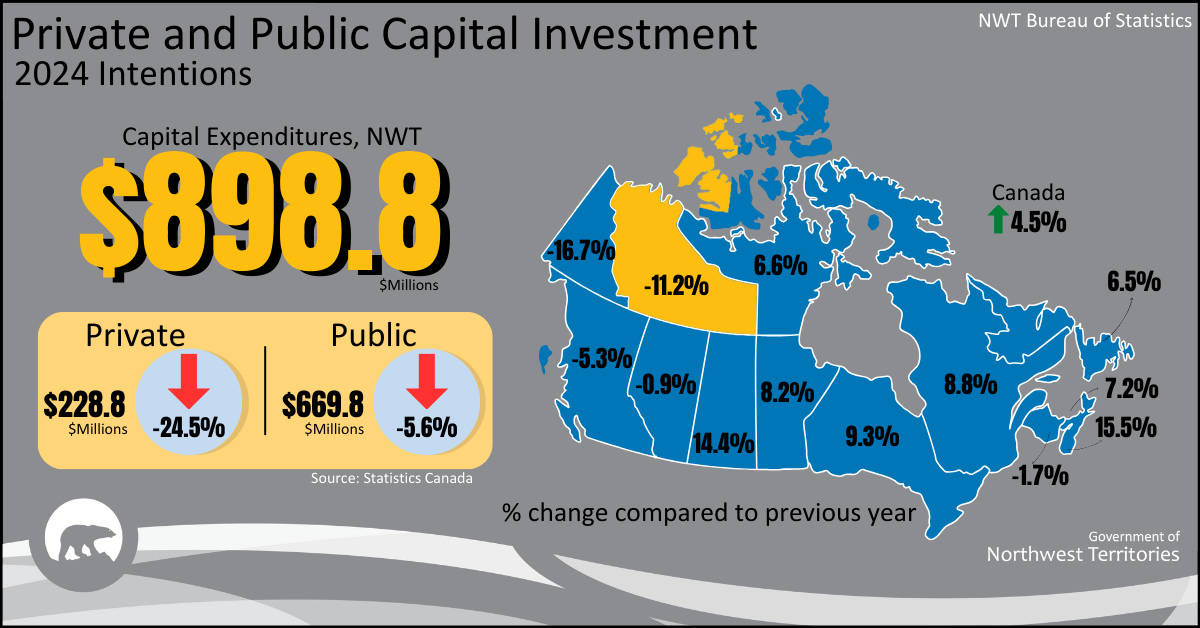
Capitial Expenditure Investment
As a major component of GDP, capital expenditures provide an indication of the current and future state of the economy and is often a sign of the state of the construction industry. Capital expenditures can be split into four types of assets: residential buildings, non-residential structures, machinery & equipment and intellectual property. Statistics Canada releases captial expenditure intentions for the year at the end of February. Quarterly expenditure estimates are also avaialbe thoughout the year.
| |
2023 |
2022 |
2021 |
2020 |
2019 |
| |
|
|
|
|
|
| Total Capital Expenditures |
943 |
875 |
560 |
470 |
724 |
| Private |
260 |
252 |
211 |
200 |
410 |
| Public |
683 |
623 |
349 |
270 |
314 |
| |
|
|
|
|
|
Downloadable Data
Capital Expenditure Publications
Capital Expentiture Intentions - 2024 | infographic